The Average True Range (ATR) is a popular technical analysis indicator that helps traders understand market volatility. Developed by J. Welles Wilder Jr., the ATR shows how much an asset moves, on average, during a given period. If you’re new to trading, understanding what the Average True Range is can be the key to managing risk and identifying trading opportunities.
What Does ATR Measure?
Unlike trend indicators that show the direction of the market, ATR measures price volatility—how much the price fluctuates. A high ATR indicates high volatility, while a low ATR means the market is relatively stable.
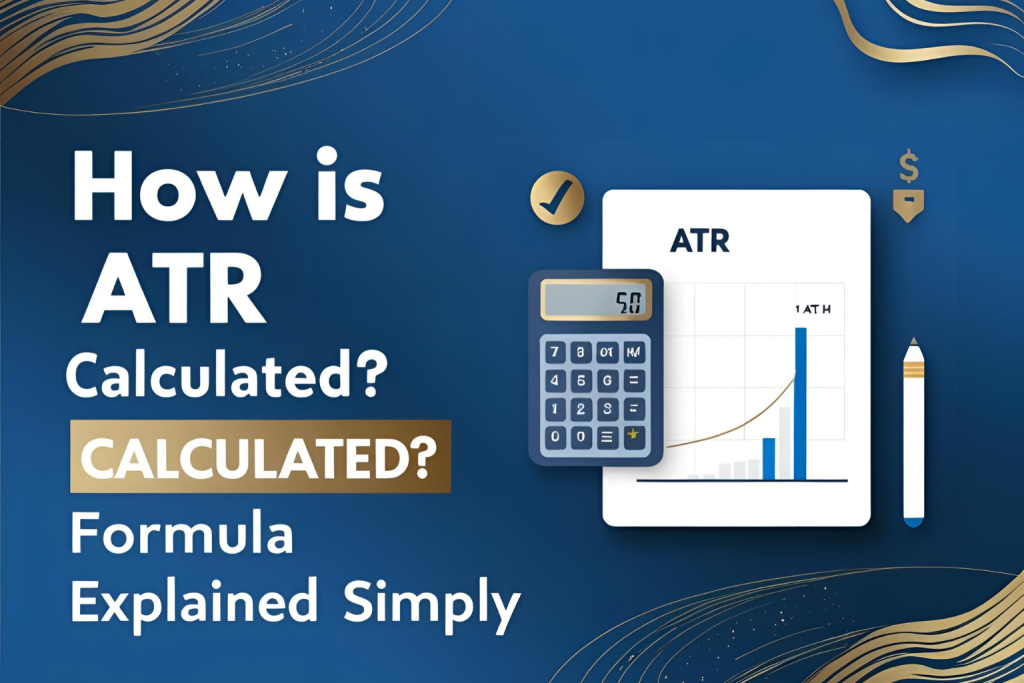
How Is Average True Range Calculated?
The ATR is typically based on 14 periods (days, hours, etc.). Here’s how it’s calculated:
- True Range (TR) = Max of:
- Current High – Current Low
- |Current High – Previous Close|
- |Current Low – Previous Close|
- ATR = Moving average of the True Range over 14 periods.
This value is plotted as a single line on your trading chart.
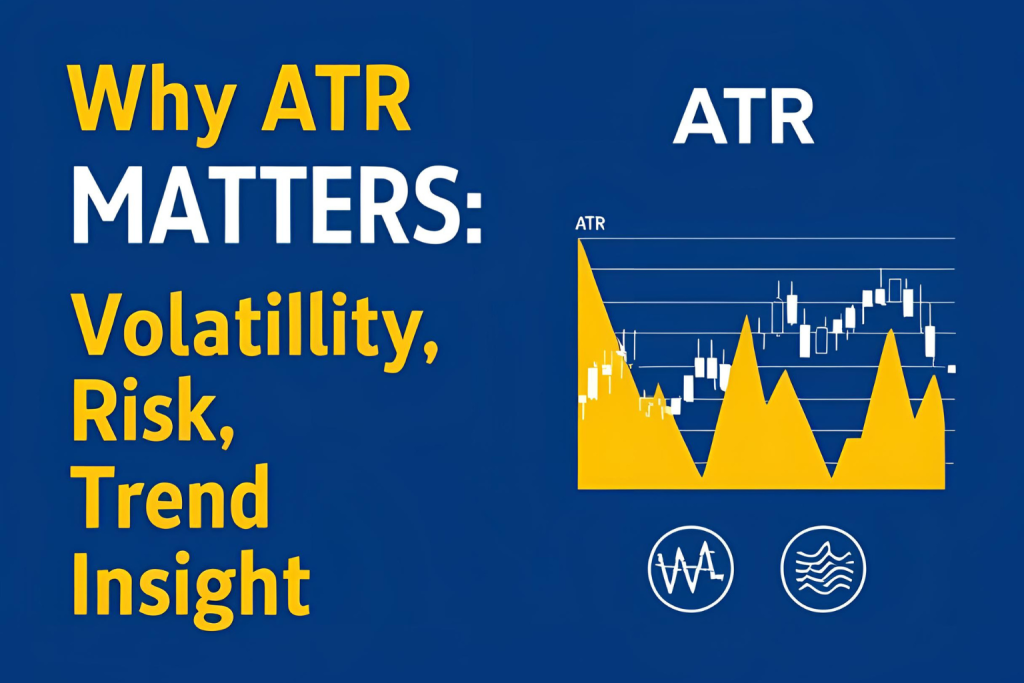
Why Is ATR Important in Trading?
- Measures Volatility: Helps determine the potential size of price movements.
- Sets Stop-Loss: Traders use ATR to set dynamic stop-loss levels based on market conditions.
- Identifies Market Conditions: Rising ATR means increased volatility, often before a breakout.
How to Interpret ATR Values
Let’s say the ATR of a stock is 2.5. This means the stock moves around 2.5 units (e.g., dollars) on average per day. Traders might use this info to decide position size or risk level.
When to Use ATR
- In volatile markets, to avoid tight stop-losses.
- During sideways movements, to confirm low-risk setups.
- As a filter for entry and exit timing in any strategy.
Final Thoughts
The Average True Range is not a directional indicator, but it is a powerful tool for evaluating market conditions. As a beginner, learning how to interpret ATR can help you build a solid foundation in risk management and trade planning.
✅ FAQs
1. What does ATR tell you in trading?
ATR tells you how volatile an asset is, helping traders measure price fluctuation over a set period.
2. Is a higher ATR better?
Not necessarily. A higher ATR indicates more volatility, which could mean more risk or opportunity.
3. Can ATR be used to set stop-loss?
Yes, traders often use a multiple of the ATR to set stop-loss levels dynamically.
4. Does ATR work for all markets?
Yes, ATR is widely used in stocks, forex, commodities, and crypto trading.
5. Is ATR a leading or lagging indicator?
ATR is a lagging indicator because it uses past price data to calculate current volatility.